

This is the second in a 3-part series on Performance Max in which we’ll cover reporting.
Signup to be notified here when the next threads drop:
👉 https://jxtgroup.com/performance-max/
Similar to Smart Shopping, Performance Max is very much a black box. Not much data is available. Here are some ideas to analyze the performance.
As you know, getting data and insights from Performance Max can be very frustrating. Here are some tips and tricks we’ve uncovered so far. 🔥
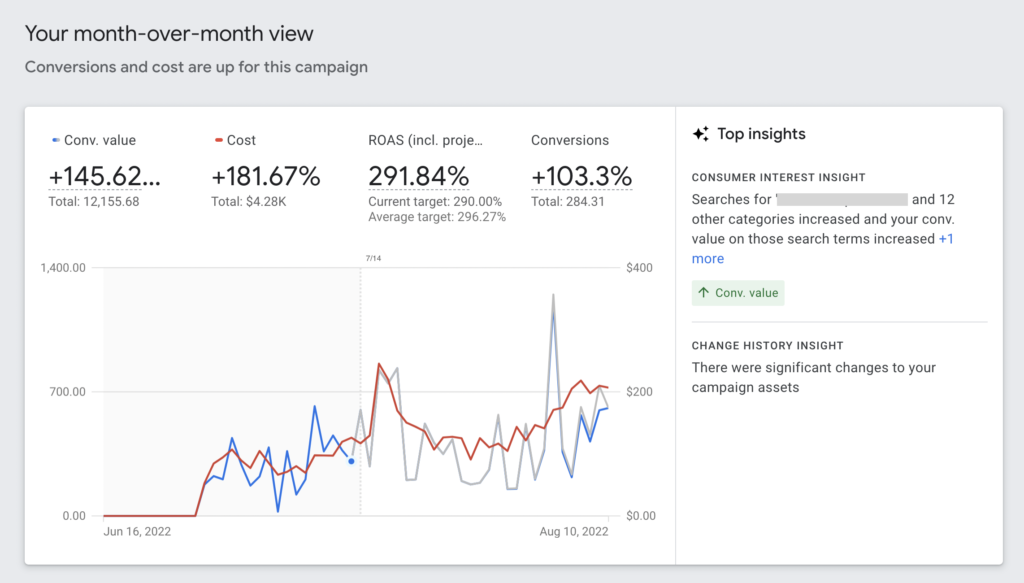
INSIGHTS: Performance Trends
While more granular data is limited, take advantage of the Insights tab. There is some useful info on overall trends. You can view week-over-week or month-over-month data.
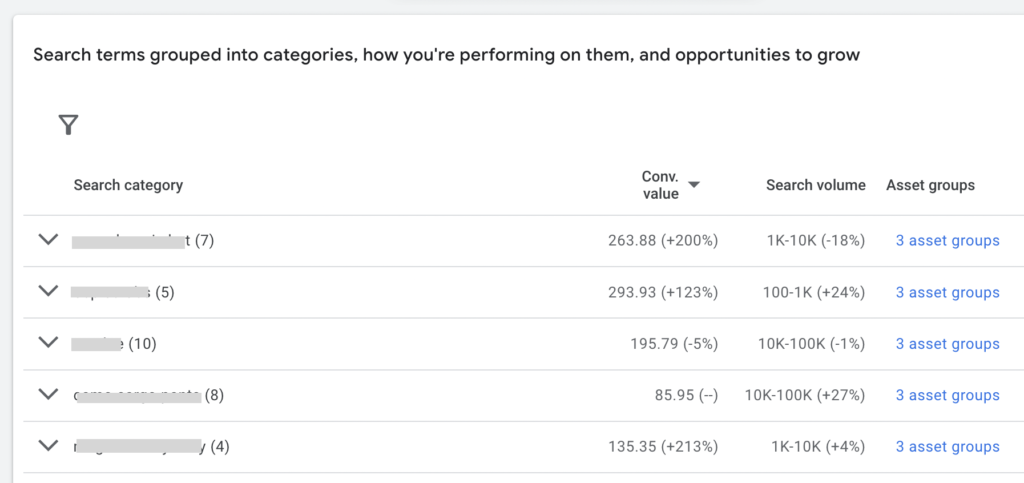
INSIGHTS: Keyword Themes
Additionally, while you cannot see actual search terms, you can see keyword themes as well as basic performance data.
LISTING GROUPS v DISPLAY
Where are your dollars being spent?
- Compare overall campaign spend in the Campaigns tab
- Vs. overall spend of all Listing Groups
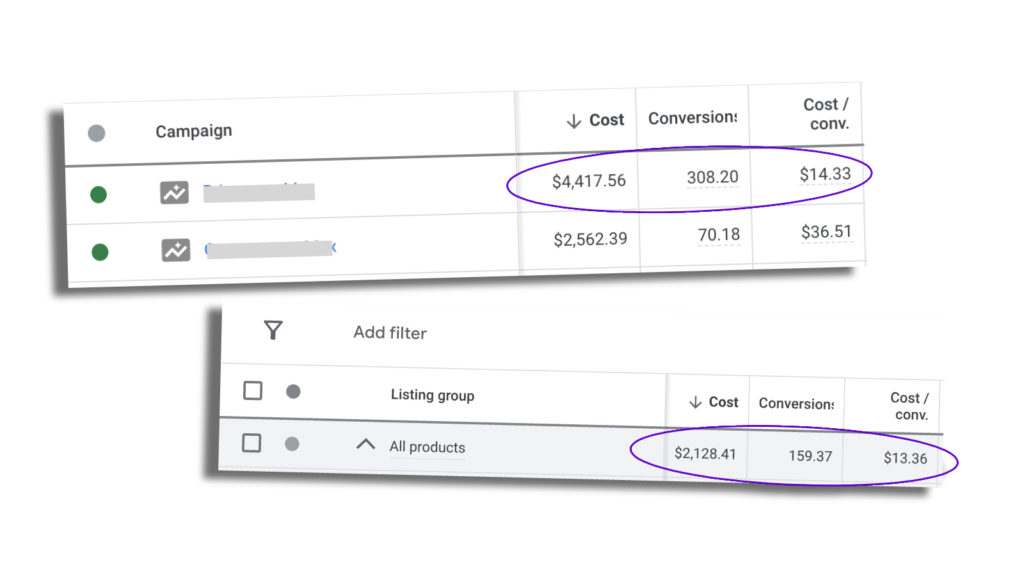 This will help you understand the spend breakdown between Video/Display and ad units created with the datafeed.
Note: If you find that Display/Video traffic is not converting as well as your datafeed, you can turn off URL expansion in the campaign settings.
You can also try running a Smart Shopping style Performance Max campaign
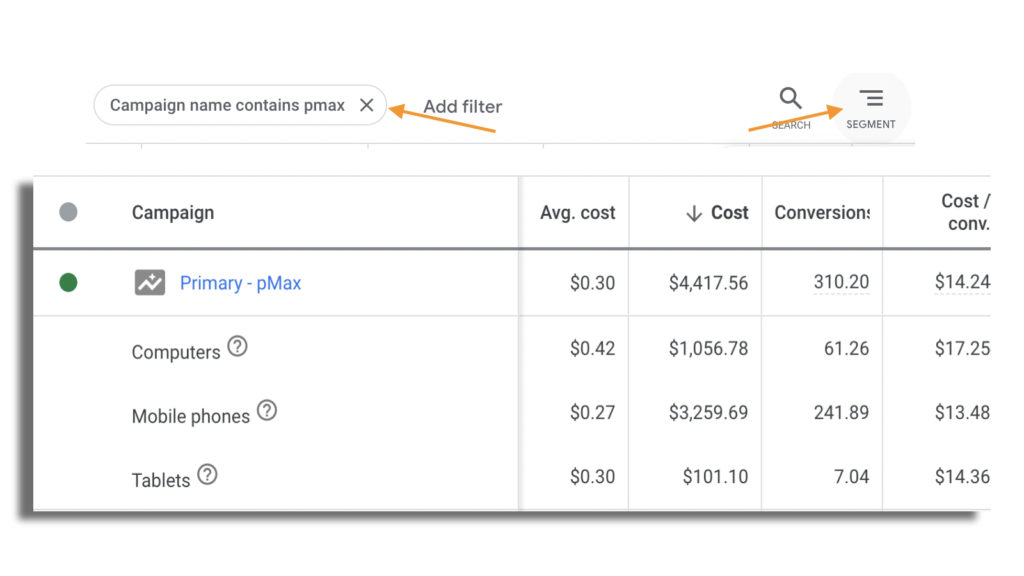
SEGMENTS: Segment your data by device, day, and time!
In the campaigns tab, you can filter by campaign and segment by:
- Device
- Day/Time
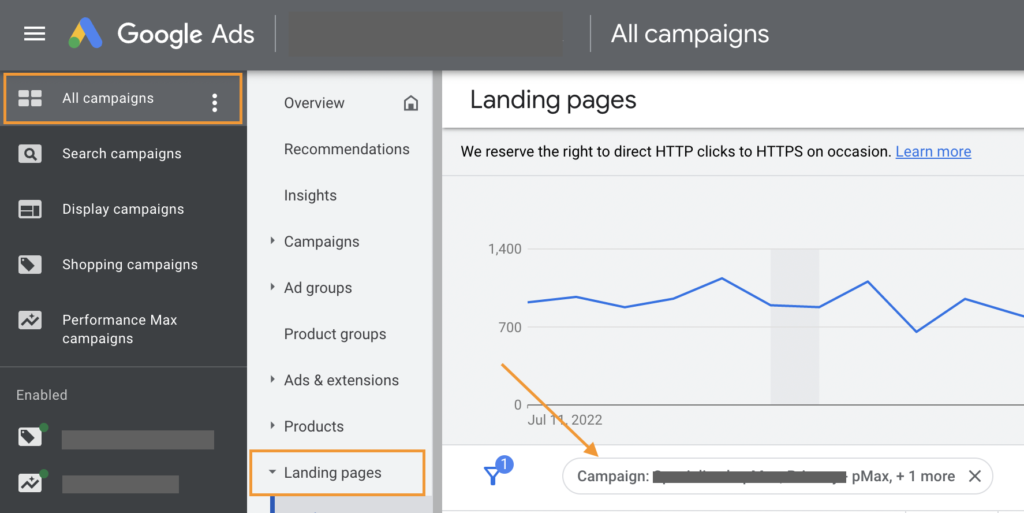
LANDING PAGES: What pages are getting traffic/conversions?
Note: This report is not available within a Performance Max campaign, you’ll need to access it from the All Campaigns tab and filter your pMax campaigns only.
All Campaigns → Landing Pages → Filter by Campaign
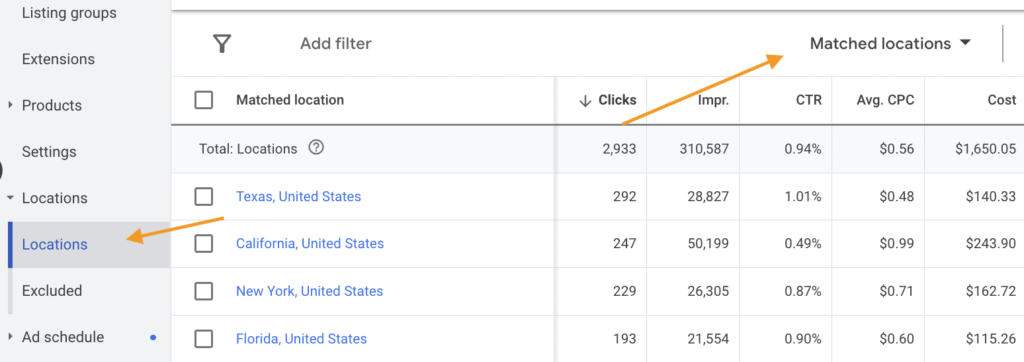
LOCATIONS: Where are the clicks and sales coming from?
In the Locations tab, you can drill down performance by:
- Country
- States
- Zip/Postal Code
- County/DMA
REPORTS: Utilize custom reports to roll up your data
Go to the reports tab and build a custom table showcasing performance by:
- Placements (Display/Video/Datafeed)
- Brand (Datafeed)
- Category/Collection (Datafeed)
- Custom Labels (Datafeed)
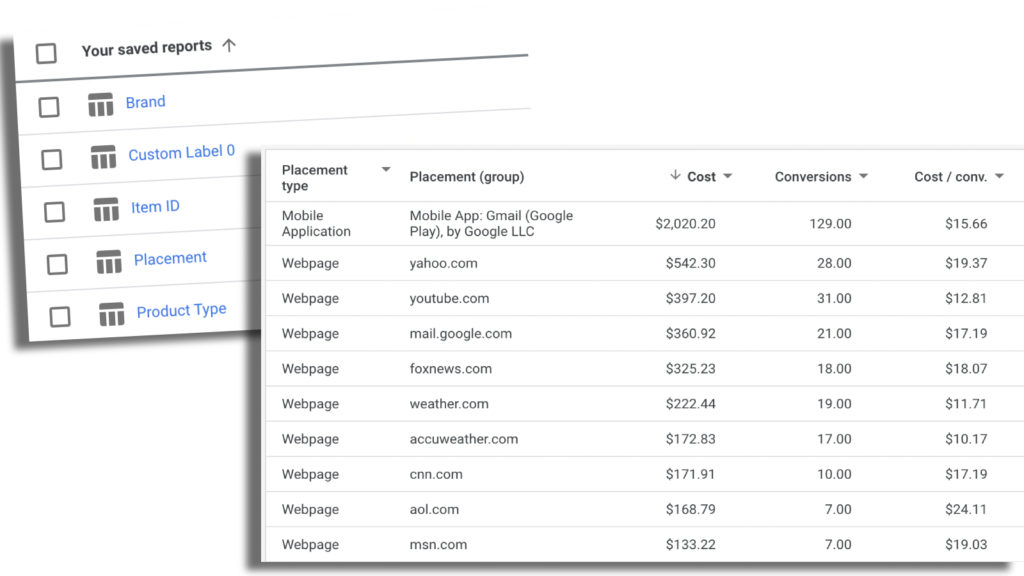
Note: Placements can be excluded on the account level.
Signup to be notified when parts two and three are published:
- Setup
- Reporting
- Optimization
Hi Menachem,
How do you manage to get placement report data for performance max campaigns?
If I build a custom placement report like on your image, it shows no data for pmax campaigns.
If I use a Predefined/other/Performance max campaign placement report, it only shows impressions.
Thanks
Pingback: ICYMI - Great PPC Posts You May Have Missed This Week - August 19, 2022 - PPCChat